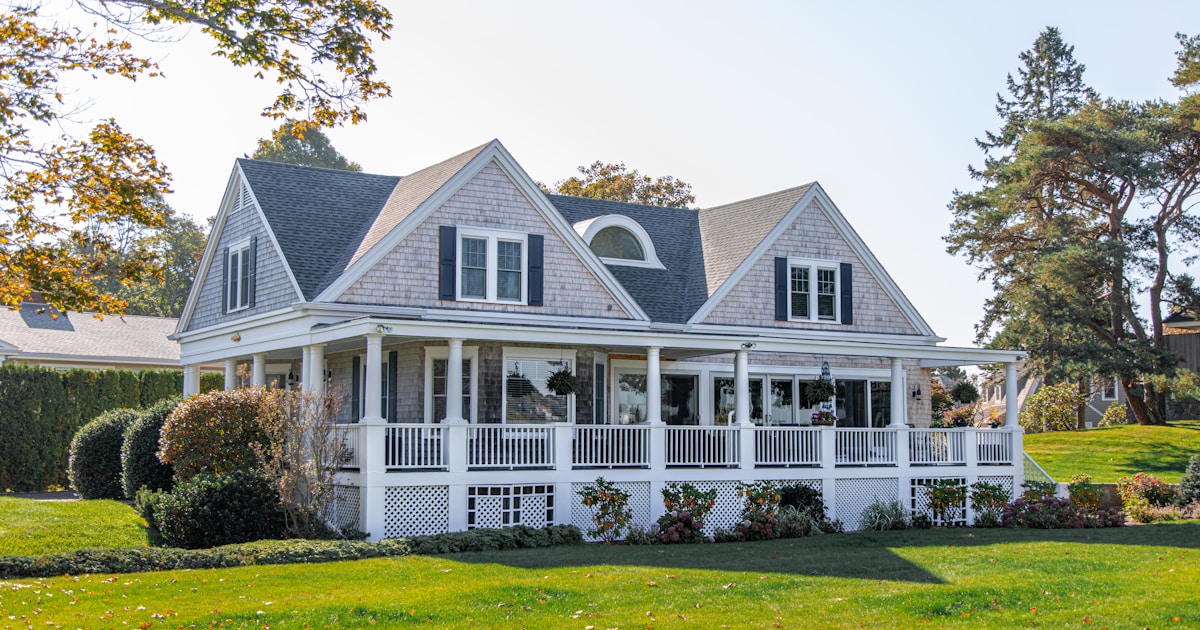
Mahwah Real Estate Market Report: October 2026
$650,000 Median Sale Price
Mahwah's residential real estate market closed October 2026 with a median sale price of $650,000 across 99 closed transactions. While this represents a modest 1.9% decline from September, the year-over-year comparison shows a more significant 8.8% pullback from October 2025 levels.
Market Overview
October brought a stabilizing influence to Mahwah's housing market after months of volatility. The 99 sales recorded represent steady transaction volume, though down from prior-year activity. The average days on market (DOM) of 75 days suggests homes are taking roughly 2.5 months to sell—a moderate pace that reflects neither a seller's rush nor extended holding periods.
Inventory levels remain measured. With 126 active listings and a months-of-supply ratio of 3.8, Mahwah sits in balanced territory. A months-of-supply reading between 3 and 5 months typically indicates equilibrium between buyer and seller interests. This contrasts sharply with the extreme conditions seen in prior years, suggesting the market has normalized considerably.
One notable metric: homes are selling at 103.9% of list price on average. This sale-to-list ratio above 100% indicates that buyers continue to bid above asking in competitive situations, even as overall transaction volume has declined. This suggests selective demand for properties that meet buyer criteria.
Price Segment Breakdown
The market shows distinct activity across three price tiers:
Under $400K (10 sales, median $340,000): The entry-level segment remains the smallest by volume, representing just 10% of October sales. Limited inventory in this range may constrain first-time buyer activity.
$400K–$700K (45 sales, median $530,000): This middle tier dominated October activity, accounting for 45% of all sales. This segment appears to be the market's center of gravity, where the largest pool of buyers and sellers intersect.
Over $700K (44 sales, median $973,500): The luxury segment nearly matched mid-market volume, with 44 sales. This tier's median price of $973,500 reflects strong activity in Mahwah's higher-end inventory, suggesting affluent buyers remain engaged despite broader market softening.
What This Means for Owners
If you're considering selling, October's data offers mixed signals. The 103.9% sale-to-list ratio is encouraging—homes are still commanding premiums over asking. However, the 75-day average DOM means you should prepare for a longer marketing window than in previous years. Pricing competitively and ensuring your home shows well become more critical in a market where buyers have more options. The year-over-year sales decline suggests less urgency among potential buyers, so strategic positioning matters.
What This Means for Buyers
Buyers face a more favorable environment than in recent years. With 3.8 months of supply and homes taking 75 days to sell on average, you have more time to evaluate options and negotiate. However, the 103.9% sale-to-list ratio reminds you that competition remains real—homes priced correctly still attract multiple offers. Focus on properties in your target range, get pre-approved, and be ready to move when you find the right fit. The mid-market segment ($400K–$700K) shows the most activity, suggesting the deepest selection and most negotiating flexibility in that tier.
Key Metrics
| Metric | Value |
|---|---|
| Median Sale Price | $650,000 |
| Sales (October) | 99 |
| Active Inventory | 126 |
| Average Days on Market | 75 |
| Months of Supply | 3.8 |
| Sale-to-List Ratio | 103.9% |
| Year-over-Year Change | -8.8% |
| Month-over-Month Change | -1.9% |
AI-generated estimates for informational purposes only. Not appraisals.
Data sourced from NJMLS and GSMLS via Garden State AI.
Want a Personalized Market Analysis?
Get an AI-powered CMA for your property — free, instant, no obligation.
Related Articles


NJ Home & Tax Insider
Weekly: property tax alerts, market news, new listings, and what's being built near you. Free.
No spam. Unsubscribe anytime. Your info is never sold.